Building a Unified Kubernetes Dashboard: Cluster Health and Pod Metrics
Why this approach works?
- Macro to Micro in One Click: Monitor cluster resource pressure (CPU, RAM, network) and immediately drill down into specific pods without leaving the dashboard.
- Event Correlation: See pod metrics, application logs, and Kubernetes events side-by-side. If a node's disk is saturated, you can instantly see which pod is writing 200MB/s.
- Shared Context: SREs get the high-level cluster health they need, while developers can filter down to see their specific application's metrics and logs—all from the same URL.
Dashboard Anatomy: Cluster + Pod Integration
Layer 1: Cluster-Wide Health
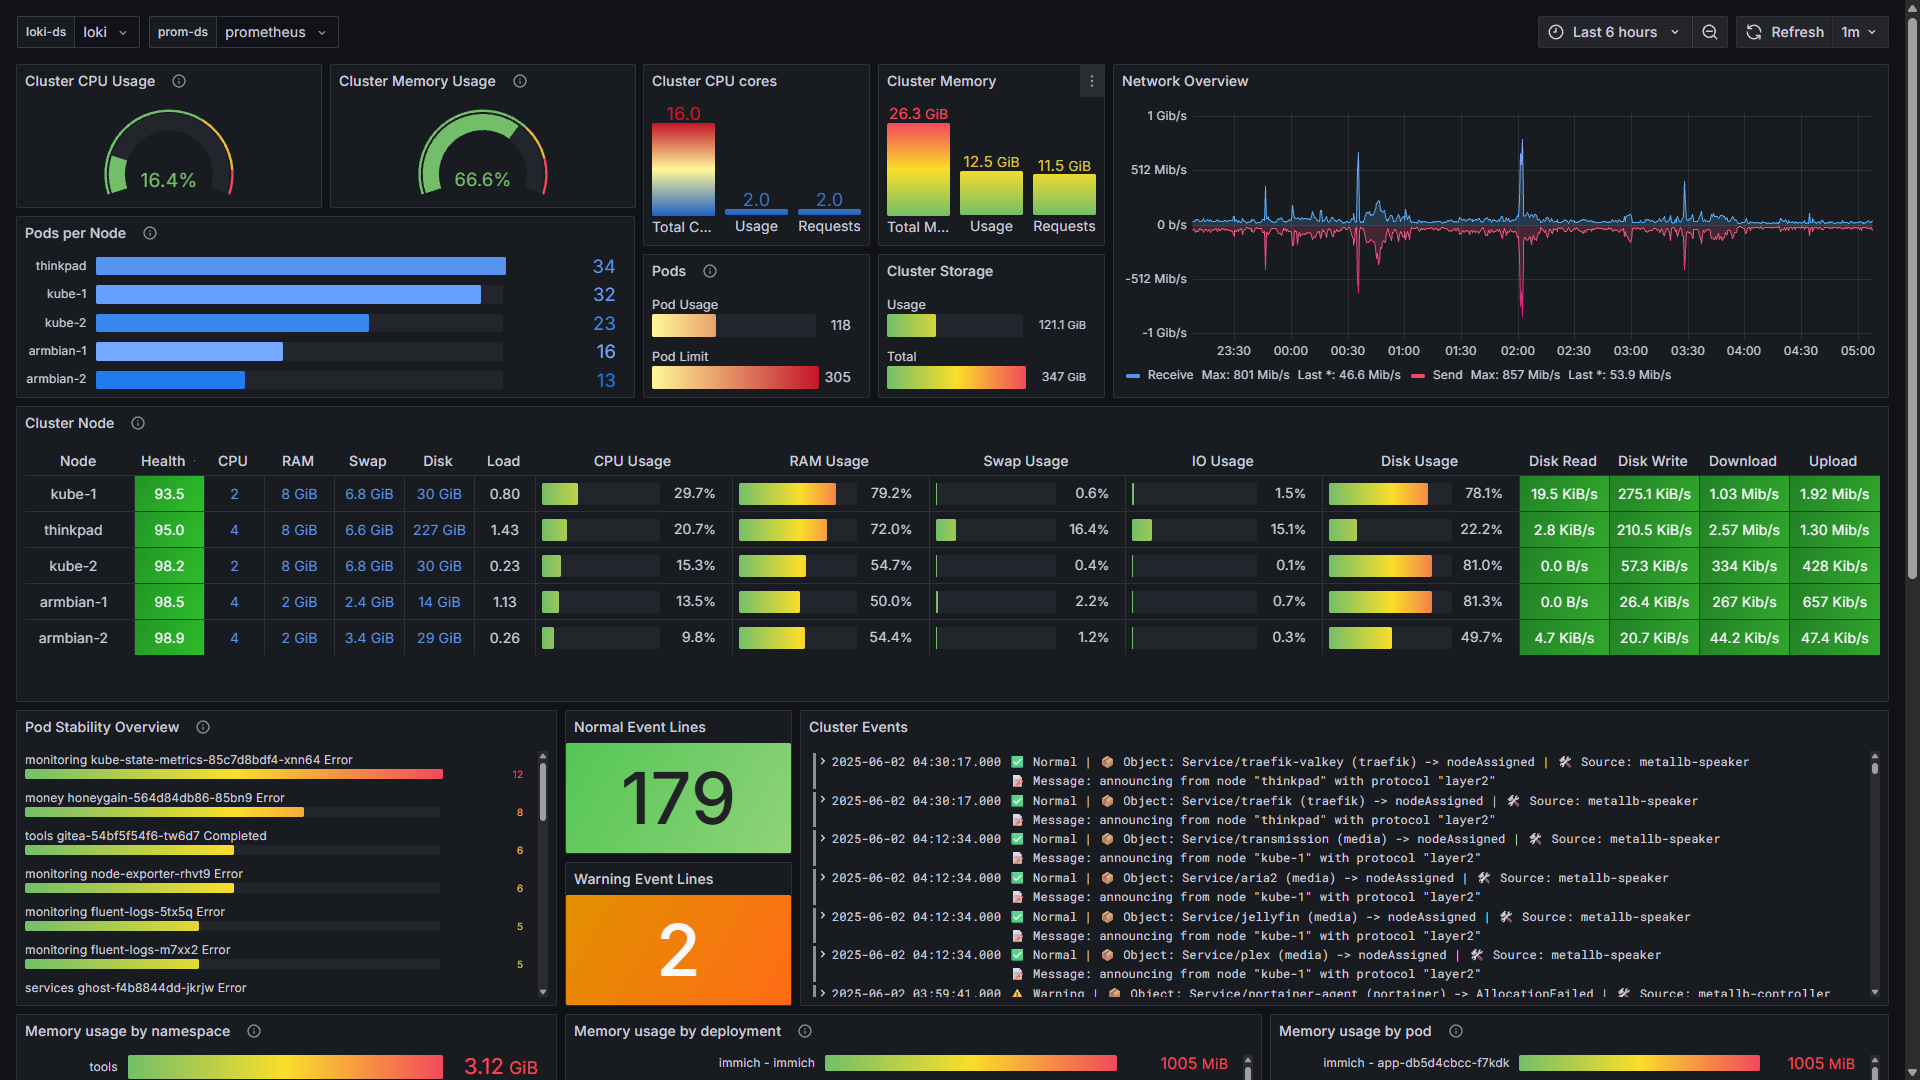
- Resource Gauges: Tracks CPU and Memory usage across the cluster, highlighting when thresholds are breached.
- Node Health Matrix: A custom health score evaluating CPU, RAM, and I/O load, visualized with gradient thresholds to easily spot struggling nodes.
- Event Triage: Surfaces Kubernetes events directly on the dashboard. It separates normal events from warnings (e.g., failed readiness probes or image pull errors) so you don't miss critical infrastructure signals.
Layer 2: Pod-Level Forensics
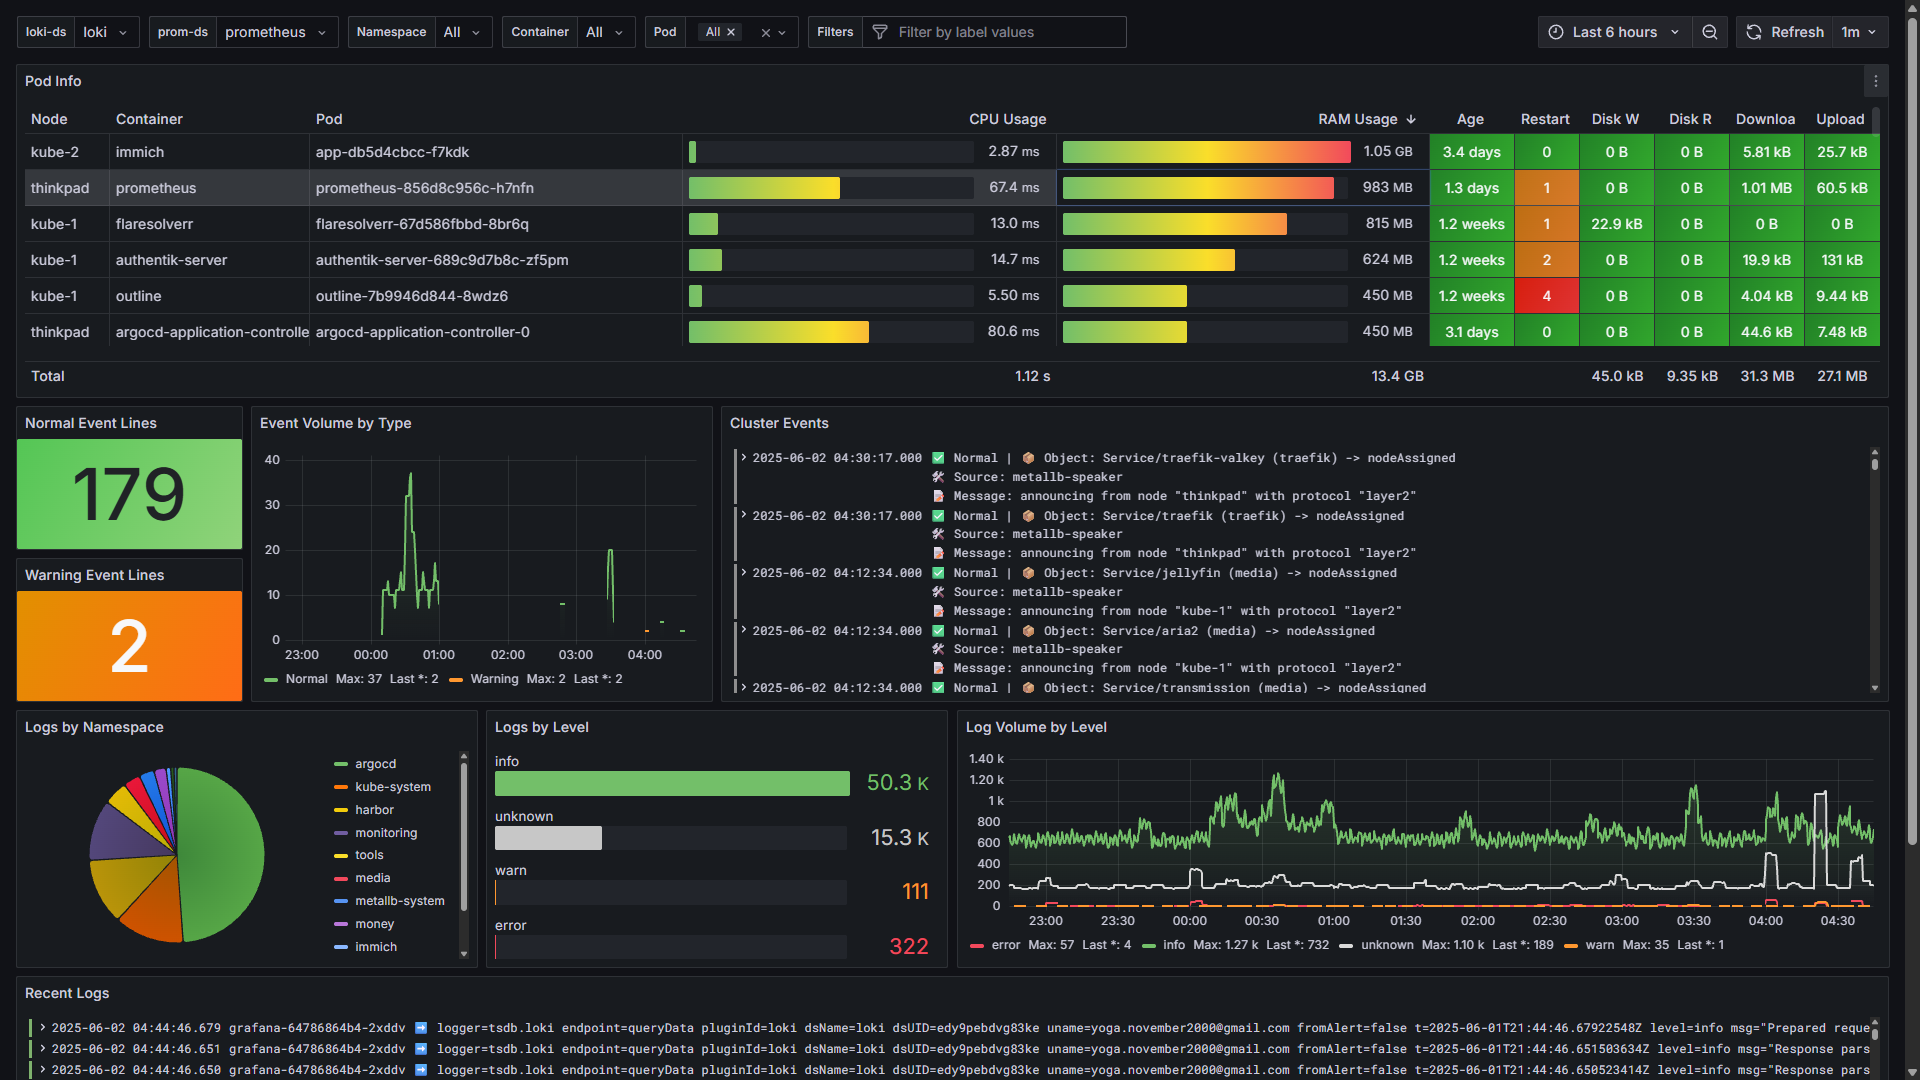
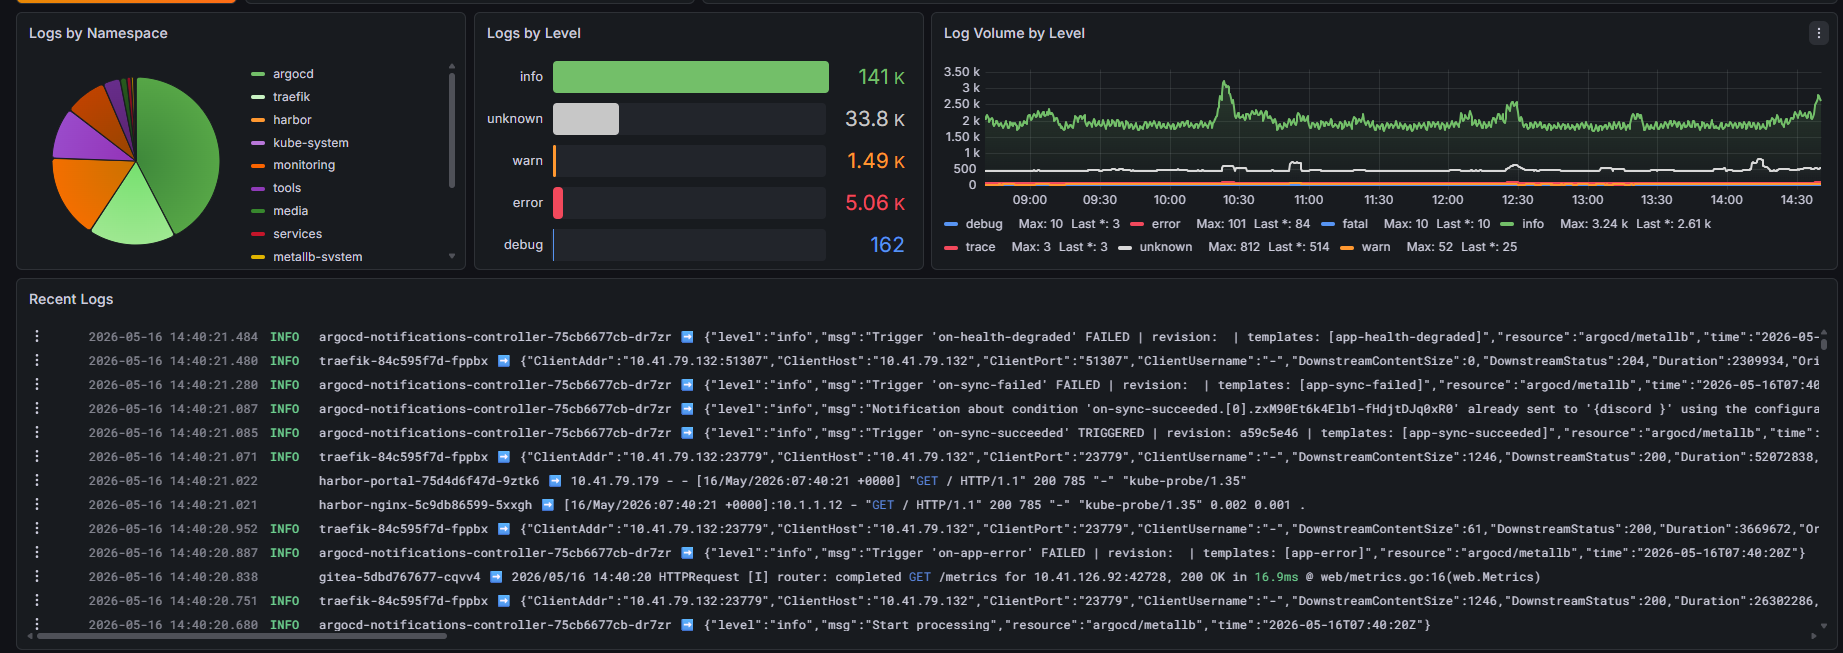
- Log Intelligence: Uses Loki to filter live logs by namespace, pod, or container. It automatically extracts log levels using regex (
| regexp \[(?P<level>[A-Z]+)\]) to visualize error vs. warning ratios. - Pod Metrics Table: Consolidates multiple Prometheus queries into a single, readable view:
- CPU Usage:
irate(container_cpu_usage_seconds_total{...}) - RAM Usage:
container_memory_working_set_bytes - Restart Counts: Highlights pods that are crash-looping.
- CPU Usage:
Layer 3: Unified Event and Log Stream
- Dynamic Filtering: Variables (
$namespace,$pod,$container) synchronize all panels simultaneously. - Correlated Timeline: If a pod shows an
OOMKilledevent, the adjacent log panel displays the exactjava.lang.OutOfMemoryErrorthat preceded it.
Under the Hood: PromQL and LogQL
Network Usage Query (Prometheus):
sum(irate(container_network_receive_bytes_total{...})) by (pod) * 8Log Formatting (Loki):
{job="fluent-bit"} | json | line_format "{{.pod}} ➡️ {{.log}}"Practical Troubleshooting Workflows
- Identifying Noisy Neighbors: If the cluster health overview shows high I/O on a specific node, filtering the pod table by that node quickly reveals which container is saturating the disk.
- Debugging CrashLoops: When a pod shows multiple restarts, the dashboard allows you to instantly check the recent logs for runtime panics, alongside the Kubernetes events indicating back-offs.
Conclusion
Consolidating metrics, logs, and events into a single pane of glass eliminates the guesswork. It provides a complete, correlated picture of your cluster's state, significantly speeding up triage and resolution times.


